True Financial

  • Home
  • My Prosperity Login
  • About
    • John Duncan – Fee Only financial planner
    • Fee for Service Financial Planning
    • Our Ideal Client
  • Advice
    • Benefits of Financial Planning
    • Cash Flow Management
    • Superannuation
      • What is Superannuation
      • What is a SMSF
      • Contributions Limits
    • Investments
      • Investment Philosophy
    • Insurance Advice
      • Insure The Stay-at-Home Parent
      • Income Protection Insurance
    • Retirement Planning
    • Estate Planning Advice
    • Business Advice
  • Articles
  • Video Library
  • Testimonials
You are here: Home / Articles

March 2, 2020 by John Duncan

Coronavirus & You

The Corona Virus. For weeks there was calm. Then suddenly there was panic. Admittedly, it was surprising. Markets have been moving upwards without a hitch for a while and initially they shrugged the Coronavirus off. Australian investors, getting little joy from cash, may have been pushing into the market. The US has been offering solid economic growth to underpin its market.

So normally the panic would have started earlier. With the market panic started, the question becomes: what now? Endless words are dedicated to how to behave when things go south. We regularly remind investors about the worst. Hopefully it means the worst is no surprise, but feelings happen. It’s ok to have feelings, just remember the market doesn’t care about feelings.

We can feel quite brave on the way up, but when the plunge happens it can be another story.

Some things to consider.

The Media

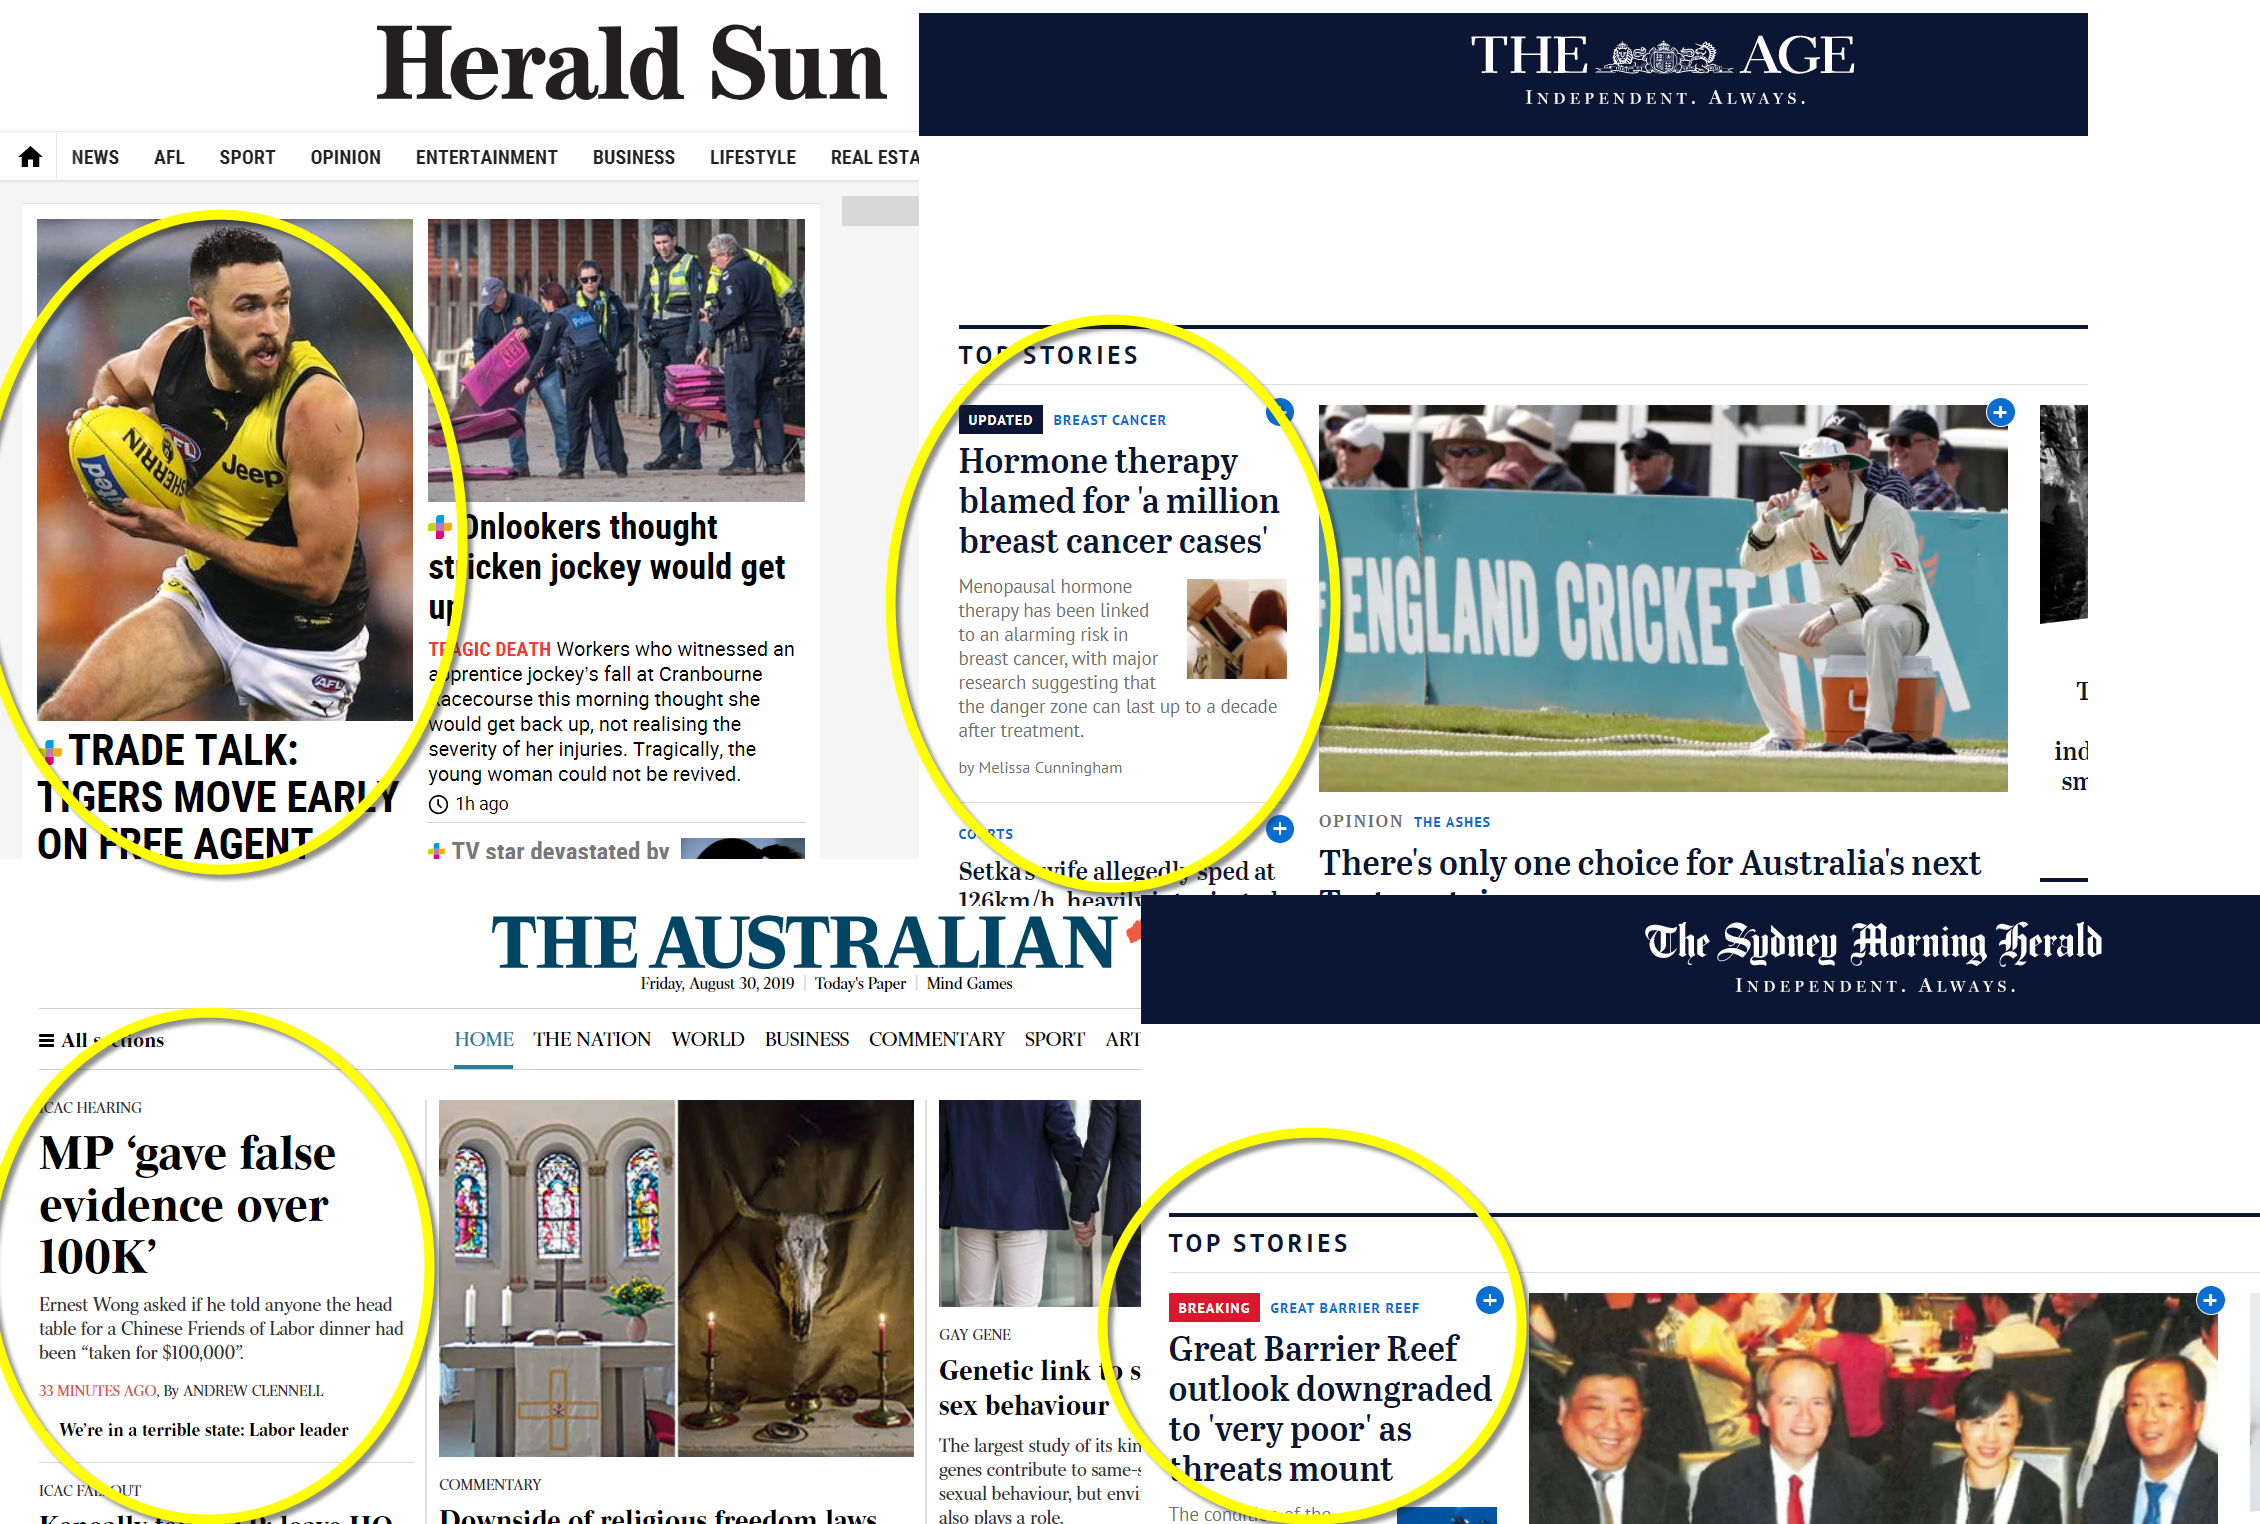
The media will continue in their attempt to pump up the issue. “How many billions wiped” and “What it means for your super” will be common leads. Various media organisations started “live blogging” the ASX trading day after a few days of falls. If you’re curious what that entails, along with an insight into the media’s motives. They sit there as the market falls 2% at open and tell us the market has fallen 2% at open. For the rest of the day they hunt every piece of ghoulish news they can find. It’s added to a continuously refreshing page on their website.

Anyone bothering to scroll through such a cornucopia of despair would likely be in the fetal position by the end of it. Incendiary and pathetic stuff. Meant to bring out the worst.

Garth Turner, a Canadian financial adviser, who was also once a journalist, wrote the following about the 1987 market crash. At the time he was business editor at the Toronto Sun.

By the time I sat down to write my daily column the Dow had collapsed 22.6%. In one day. The worst crash on record. More than 1929. Terrifying. As I wrote I glanced up at a crowd of co-workers standing around that dinging clunker in mute shock. Then I sent my assistant to the newsroom library to dig up pictures of breadlines from Depression-era Toronto, which I irresponsibly published the next morning.

So what happened?

Despite the historic disaster in the autumn, 1987 finished positive for the markets. Over the next two years it advanced 12% and 26%. No 1930’s rerun. Everyone who sold on October 20th seriously regretted it. And I regret I lacked the experience and knowledge to do what my public-facing job demanded – provide a balanced and responsible commentary.

Such reflection is rare. There won’t be any of it from the media for as long as the Coronavirus lasts. Keep that in mind.

The Markets

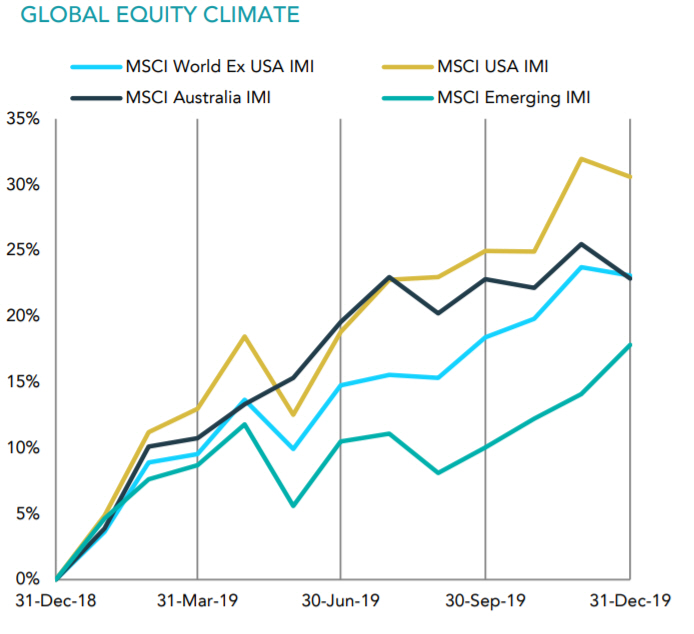
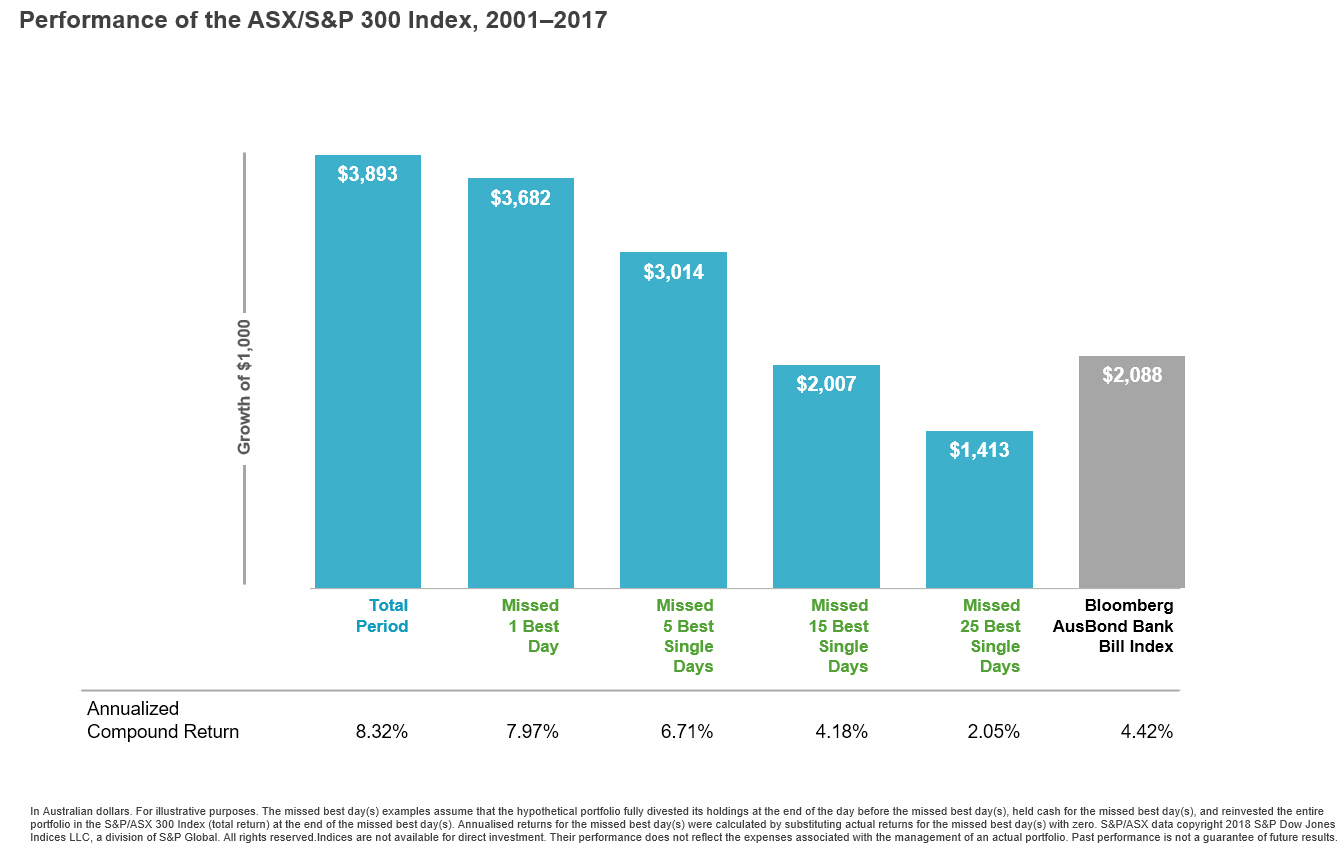
Don’t lose sight that corrections aren’t rare. Australian and world sharemarkets have been on a tear for a while. A genuine correction has been absent. That is rare. We’ve been in a good paddock. Last August we had a 5% pullback before a quick recovery. It’s been steadily upwards until this week.

Some perspective with this chart. The grey lines highlight the ASX All Ords annual returns (absent dividends) for the past 35 years. The red dots represent the largest annual falls the market had during those 35 years.

The dots don’t lie. Most years there will be a double-digit fall. The average fall in this instance is 12%. Usually there is another minor sell off throughout the year. Two sell offs a year. It’s the price of admission.

It’s important to take note of the ‘flattish’ years. Where there is a 0% or slightly negative or positive return. An investor may have to ride a 17% correction to get a 0% return from the sharemarket for that year. The reality of risk. Not pretty, but the best system we have. For some it’s not palatable. It’s why they don’t invest. Alternatively, they seek refuge in the arms of those promising safety and returns without risk. That rarely ends well.

You and Us

As your adviser, we will be humble enough to admit we don’t know anything about this virus, nor where it might take us. Anyone who offers any certainty should be dismissed. We can look at the past

as a guide for market impact, however it’s no road map. The Coronavirus is spreading faster than previous epidemics. Thankfully it appears less deadly.

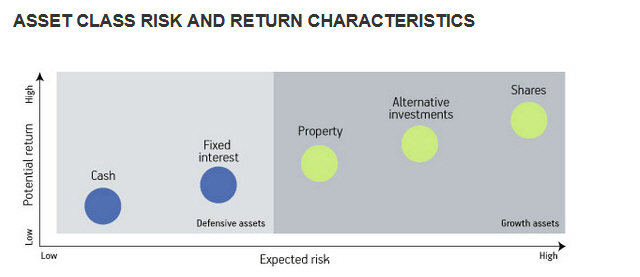
Markets are unpredictable so we plan around lives and goals. We’re not trying to avoid the red or only capture the green. Your portfolio’s focus is the whole and what that amounts to over a longer period. Portfolios and budgets are built around the good, bad and ugly. Keep in mind you won’t have 100% of your portfolio in sharemarket funds.

For retired clients: We use effective cash management strategies. Taking advantage of harvesting and rebalancing opportunities. This is intended to quarantine cash for spending needs. It also aims to keep investors from selling down when markets are falling.

If you challenged us last year about selling from a fund that was performing well. This is the exact reason why it happened. Gains get quarantined when the opportunity arises. Your cashflow needs are met without going back to your portfolio in uncertain times.

For accumulators or opportunists: We don’t time markets, but a sharp fall or correction is better thought of as a discount. It’s just not advertised that way. If you believe we will overcome and get through this, as with every other challenge humanity has faced, November’s prices are now available in equities again.

Some guesses on things that may happen:

The virus will likely get worse. Then it will likely better. Central banks will intervene. Governments will likely spray some stimulus. Economies will spike as demand returns. Markets will recover as the American election cycle hurtles towards a conclusion. Australia’s economy will remain sluggish. US Corporate profits will continue. People who ignore things will sail through. Those who panic and sell will regret it later.

There are no fixed dates on any of these things. All remain guesses, but we’ve seen enough to be certain of the last two.

Most importantly – take care of your health.

This represents general information only. Before making any financial or investment decisions, we recommend you consult a financial planner to take into account your personal investment objectives, financial situation and individual needs.

Filed Under: Uncategorized

January 17, 2020 by John Duncan

December 2019 Quarterly Review

Economic Overview

The geopolitical risks that dominated for much of 2019 faded in Q4, supporting global share markets. Trade uncertainty faded with the US and China’s phase one trade deal announcement, while economic data remained stable. The trade deal, signed on January 15 means planned new tariffs will not be imposed, while US tariffs imposed in September on $120 billion Chinese goods will be reduced by half. The 25% tariffs on $250 billion of Chinese goods will remain. China also agreed to increase purchases of US goods, with agricultural produce highlighted.

The US Federal Reserve cut interest rates once in the quarter before indicating that “the current stance of monetary policy is appropriate”. The US economy expanded by 2.1% (annualised) in Q3. A result better than expected and stronger than Q2.

In the Eurozone, the confidence measure among German executives, improved in December, yet the Eurozone purchasing managers’ index remained unchanged at 50.6 in December – a level that indicates weak growth. Annual inflation was 1.0% in November, up from 0.7% in October but still well below the European Central Bank’s target of close to 2%. Christine Lagarde, in her first major speech as president of the European Central Bank, urged governments to boost public investment in order to increase domestic demand in Europe.

In the UK, the Latest GDP figures confirmed the economy had avoided entering a technical recession in the third quarter after contracting in the previous quarter. GDP growth was 0.4% quarter-on-quarter. Overall, the data suggests that the economy is coping with the uncertainty from Brexit. After the landslide election victory for the incumbent Conservative Party, the government is set to use its large majority to take the UK out of the EU by 31 January 2020, entering a transition period when the next stage of negotiations will begin.

Japan’s economic data continued to show a significant divergence between the strength in service sectors and the weakness in manufacturing. There were also signs that the long-running trend towards an ever-tighter labour market had finally reached its natural limit. The main economic event for the quarter was the consumption tax increase on 1 October.

In Australia, the RBA cut the official cash rate to 0.75% in October. Despite predictions of further cuts, none eventuated during the quarter. Eyes now turn to the RBA’s first meeting in February. While the RBA noted in its December minutes that, “the Australian economy appears to have reached a gentle turning point” it also finished those minutes by noting, “the Board is prepared to ease monetary policy further if needed to support sustainable growth in the economy, full employment and the achievement of the inflation target over time.”

Market Overview

Asset Class Returns

The following outlines the returns across the various asset classes to the 31st December 2019

Overall, it was a mixed quarter to top off an extremely strong year. The majority of the Q4 gains came from global shares. US markets pushed higher as trade uncertainty faded, while Eurozone markets advanced with better economic data emerging from Germany. Bond markets reflected the better mood in the quarter as government bond yields rose (prices fell) and corporate bonds performed well.

Across the year it was hard to miss a good return, both Australian and global shares returned 20%+ returns, while Australian listed property was pushing 20% and fixed interest was given a shot in the arm as yields fell and prices increased. The asset class doing no one any favours? Cash.

In the US, the tech sector was a major beneficiary of easing trade tensions. Energy companies, which had lagged the broader S&P 500 index in 2019, rallied as the oil price rose on lower-than-expected supply.

Eurozone shares notched a strong return in the final quarter of the year, with the region’s MSCI EMU index returning 5.1%. Listed companies were supported by better economic data from Germany as well as the phase one trade deal agreed by the US and China. Gains were led by sectors that generally fare well when the economy is strengthening; top performing sectors included information technology, consumer discretionary and materials.

UK equities performed relatively well, and domestically focused areas benefited significantly as they responded favourably to the reduction in near-term political uncertainty.

The Japanese market rose in each month of the quarter to record a total return of 8.6%. Asia ex Japan delivered a strong return in Q4, supported by easing geopolitical risk as the US and China reached a phase one trade deal. US dollar weakness also provided support to returns. Against this backdrop China, South Korea and Taiwan all outperformed. In Taiwan, strong performance from technology sector companies boosted returns, as earnings expectations were revised upwards following solid Q3 sales figures

Emerging market shares posted a strong gain in Q4, benefiting from easing geopolitical concerns. The MSCI Emerging Markets Index increased in value and outperformed the MSCI World.

After a double digit first half of 2019, you might say the ASX coasted home with lower returns in Q3 and a meek 0.75% return for Q4. Notably, it did pass its previous record high in November. Q4 was hampered by a weak December with concerns over Christmas retail figures, the strengthening Australian dollar and improving employment figures, which paradoxically became a negative with the ASX counting on the support of further interest rate cuts. Meanwhile, three of the four big banks, NAB, ANZ and Westpac, struggled through Q4 with either more scandal or cuts to earnings and dividends, proving another drag for the ASX in Q4.

2019 Take outs

As we’ve noted, it was hard to go wrong in 2019, unless you had a bank account stuffed with cash or a poorly diversified portfolio stuffed with bank shares – or worse, a combination of both! Major asset classes all delivered stellar returns and when combined into a balanced portfolio of 60% growth assets/40% defensive assets the return was 16.74% for 2019, after a 1.01% return in 2018. Remarkably, the 2017 return for such a portfolio was 8.17% and the 2016 return 8.01%.

How reliable is that consistency? The average annual return for this portfolio is 8.27% for the past decade. The worst return came in 2011 with a -1.00% return, with 2019 being the best. Which shows if you’re prepared to ride out the sub-par years the realignment can eventuate, along with the rewards.

The on again off again trade tensions have proven somewhat farcical. A sniff of negative would take the market down and a whiff of positive would drag it back upwards. When the trade issues move into the background it will be interesting where global markets will take their cues from next. The US presidential race will likely be a focus. Just remember 2016 and the damage Donald Trump was supposedly going to inflict on world markets.

Whatever the focus, it should remain as a matter of interest, not a matter of concern. 2019 was a reminder that we should never react because our expectations may not align with market responses. There was significant concern as 2018 ended. Economic momentum was slowing, earnings growth was in question and optimism was low.

2019 returns were unexpected and more than anyone could hope for.

Does it mean anything for 2020? No. 2020 will have no memory of 2019, just as 2019 had no memory of 2018.


With material from Schroders & DFA Australia.

This material is provided for information only. No account has been taken of the objectives, financial situation or needs of any particular person or entity. Accordingly, to the extent that this material may constitute general financial product advice, investors should, before acting on the advice, consider the appropriateness of the advice, having regard to the investor’s objectives, financial situation and needs. This is not an offer or recommendation to buy or sell securities or other financial products, nor a solicitation for deposits or other business, whether directly or indirectly.

Filed Under: Uncategorized

October 4, 2019 by John Duncan

A Shock from The Electric Car Revolution

They were the subject of much derision at the last federal election. Before you say the Labor party, no.

Electric cars.

What’s powering them (besides electricity)?

Batteries. Charge them up and away you go – hopefully for a few hundred kms. Most of the battery focus has centered on the lithium-ion battery. There’s no need to get too deep into various battery chemistries, but some of the minerals and metals required to make the battery are lithium, nickel, cobalt, manganese and graphite.

The race to manufacture the batteries has resulted in the construction of a significant number of battery mega factories around the world. According to Simon Moores of Benchmark Mineral Intelligence, a lithium battery consultancy, at last count there were 70 lithium ion battery megafactories in construction. By 2028 battery production capacity will potentially be able to power 23-24 million sedan sized vehicles.

Sounds exciting, especially for investors who want a piece of the action.

Where is the easiest place for investors to get targeted exposure to the electric car revolution? Car makers? Nope. They’re mostly boring dividend payers. Battery makers? Nope. Many are already integrated within chemical and electronic companies.

It’s exploration and mining companies.

If all goes to plan, there will be an increasing demand for all those raw materials mentioned earlier. They’ll need to be mined, or in lithium’s case, mined or extracted from brines. A lot of hype and a lot of stories. And a lot of opportunities for hyped up investors to lose their shirts.

How long before that happens? You might be surprised. We’re only in the early stages of this automotive change and there’s already been one boom and bust. A lot of investors are already walking around shirtless.

Firstly lithium. Keep in mind there is various lithium pricing because there are various sources of lithium. It can come from brines where salt flats are located. Most of the world’s lithium in this form comes from South America. Alternatively, it can come in hard rock form. Australia is the world’s largest producer of hard rock lithium.

Whatever price you’re looking at, it’s been on a consistent downward slide for lithium since the start of 2018. Why would this be? As always, same old story in mining. There’s a demand. Companies rush to build mines and fill the void. They fill the void (and some) with the end result of punishing themselves and their investors in the process. A story old as time, but one always forgotten during the boom phase.

In August, Alita Resources went into voluntary administration. Production at Alita’s Bald Hill mine in Western Australia lasted just over a year. One of the bigger (temporary) success stories, Pilbara Minerals, slowed operations at its Pilgangoora mine in WA. Pilbara also made a number of staff redundant last month and laid off contractors before embarking on a $91 million capital raising to get itself through the downturn. A year ago, Pilbara shares traded at 86 cents, at last check they were at 30 cents.

It’s a similar story across the industry. Investors in the big overseas listed miners, SQM and Albemarle have seen 50-60% losses over the past two years.

Cobalt was the other hyped story. It’s meant to be even scarcer than lithium. Investors started to think of the riches to be made for anyone who jumped on board. Where do you invest to get cobalt exposure? 60% of the world’s cobalt comes from the Democratic Republic of Congo (DRC). Swiss miner and commodity trader, Glencore, has a significant piece of that market.

Cobalt, like lithium, has proven to be another story of burnt fingers. However, unlike lithium, there’s been little in the way of new mine progress. The hype train pushed the cobalt price upward with plenty of explorers grabbing mining leases in the hope of getting lucky. If you want to see how well they fared, it wasn’t much different to the cobalt price. Up on hype and straight back down again.

In the DRC, two thirds of the population live on between $1-2 a day. A lot of cobalt is accessible by individual miners with hand tools. When the price rocketed, a lot of people in unfortunate circumstances had an opportunity to make some money. At the same time, Glencore increased its production. Suddenly warehouses in southern Africa were full of cobalt. Oversupply pushed the price down again.

Glencore has now halted production at its largest mine, Mutanda, and is also in a standoff with the Congalese government over mining royalties.

It’s always tempting to be on the lookout for the next great advancement. Speculators who can jump onboard early enough might make themselves a quick buck. They just need to know when to get out. Very few people picked the top in the last lithium and cobalt spike. Look on investment forums and you’ll find trapped investors who rode the prices downward now grasping for any piece of information indicating those prices might recover their previous highs.

As we regularly say, great stories don’t always make great investments. Long term, if the electric vehicle story is a winner, the gains from the car makers, battery makers and miners will find their way into the various funds a globally diversified portfolio holds. That ensures, as with every other sector and industry out there, an investor will capture some of the gains and be protected from the worst of the losses.

This represents general information only. Before making any financial or investment decisions, we recommend you consult a financial planner to take into account your personal investment objectives, financial situation and individual needs.

Filed Under: Uncategorized

September 13, 2019 by John Duncan

Media Omission & the Market

“The markets haven’t been very good lately,” the investor said with some concern. “Should we be doing something?”

Markets were off their highs. Trump was being Trump. August had been one of those months. Off nearly 5% in a week. Sideways for the next three. A slight upward burst at the end, but the media had been salivating at the prospect of more losses. The wind had stopped blowing and the seas had calmed. The investor was still thinking about those storm warnings.

“Well the ASX All Ords is up about 19% until the end of August,” the adviser said, bringing up a returns chart.

“That’s strange, I could have sworn we’d been doing pretty badly this year,” returned the confused investor. “Interesting.”

August, and its last day, is an interesting study on why that might be.

Earlier in the month these are some of the headlines leading broadcasts, gracing newspaper front pages and taking the top left on news websites throughout August:

Bloodbath for share markets: Here’s how it affects you

ASX drops 128 points in worst loss of 2019

Trade war wipes $38b off ASX

Aussies’ super smashed as USA-China trade war hits ASX

Australian stock market slumps after US-China trade war prompts Wall Street plunge

Investors told to brace for more volatility as ASX sells off

Yes, it could be recency bias. The tendency to let the most recent events weigh heavily in one’s mind, but that’s only able to occur if a person is confronted by all information.

Below are the homepages of four well known Australian newspapers on that last day in August. The ASX All Ords finished up 93 points that day or 1.4%. It was up over 100 points when these screenshots were taken. You’d think such a great day would have warranted some interest by the media; telling us how many billions had been ‘wiped on the ASX’, what the gain ‘meant for us’ and how important it was for ‘our super’.

After all, those top left corners are usually reserved for important stories reminding us how much we’ve lost on the down days.

Nary a mention.

The day’s gains were buried much further down the page. Positive market news relegated to the business & finance section. Flicking through the nightly news it was a similar story.

Media bias by omission is why investing is so hard. It explains why some people are scared of the sharemarket. It also explains why sharemarket investors regularly think they’re doing worse than they are.  If we use months as our guide, 63% of the time the ASX is heading upward. It’s 72% of the time if we’re using years.

The likelihood of a 100-plus point down day leading the news? We can only guess, but we’re assuming it’s very high.

The likelihood of a 100 point-plus up day leading the news?

Looks like zero.

This represents general information only. Before making any financial or investment decisions, we recommend you consult a financial planner to take into account your personal investment objectives, financial situation and individual needs.

Filed Under: Uncategorized

June 7, 2019 by John Duncan

Convictions Are Great Until They Aren’t


June 6, 2019

Neil Woodford has a neck thick like a rugby player and a head shaped like it was chiselled out of granite, it could be mounted somewhere on Easter Island. Imposing is an appropriate word to describe his appearance. Woodford is a man screaming conviction.

Charlie Aitken is almost the opposite, but no less memorable. His features are sharp, he’s thin. Hair slicked back, often wearing a smug smirk; he appears supremely confident, giving the impression you should be listening to him. Aitken is a man screaming conviction.

While Woodford looks like he could be cracking heads outside a nightclub and Aitken cracking jokes on a late-night talk show, they’re both in the same business. They both manage money and lately it hasn’t been going so well.

Woodford was known as a star stock picker during his time at UK investment manager Invesco, so in 2013 it was time to set up his own fund. He started off strongly.

In his first full year on his own, Woodford’s flagship fund returned 16 per cent, beating all 50 of its peers tracked by Bloomberg. That has all changed, with the fund down 7 per cent this year through May 31 and down 18 per cent in the past 12 months.

And those falls have caused panic with Woodford’s investors.

Neil Woodford’s problems are a fund-management version of that old-fashioned bank run. Investors in the Woodford Equity Income fund have been asking for their money back at a rapid rate – about £10m a week. Unlike a bank, the fund has all the money – but it is invested in a series of companies.

To come up with the cash at once, the fund would be forced into a fire sale, with the result that investors would almost certainly get back less – much less – than they put in.

To stop the rot, this week Woodford suspended trading in his flagship fund in the UK.

Back in Australia, Aitken was one of Australia’s better-known stockbrokers before he made the leap to start his own fund in 2015. He attracted high profile investors such as billionaire Kerry Stokes and was said to have $300 million in funds under management. The fees were 1.5% and 15% of any outperformance over the fund’s benchmark.

Aitken’s Global High Conviction Fund started off promisingly enough. It outperformed its benchmark, the MSCI World Index, until 2018 when the fund fell almost non-stop throughout the year.

Aitken Investment Management’s Global High Conviction Fund suffered a 23.8 per cent loss in 2018 after being defeated by macro conditions that undermined the strategy’s pro-Asia bets.

This year it has lost further ground as the MSCI World’s recovery has been much stronger than that of Aitken’s fund. With that stinker of a return fresh in the memory, things are also happening at Aitken’s fund. The biggest investors apparently want change.

Rather than expand the stock picking team, we’ve heard the telegenic Aitken — we gather after some nudging by Stokes and Rankin — is going to recreate the business as a branded global index fund, with some high-conviction calls on the side.

Sounds like a fund available for 0.3% from a regular fund manager. Unless the pencil is sharpened on fees, any investor will pay Aitken an extra 1.2% for a little speculative indulgence. Hardly seems warranted.

Both Woodford and Aitken are known as conviction investors, but there is a problem with convictions. When you have convictions, investors expect your convictions to be right and they don’t give a damn about your convictions when they’re wrong. They have zero patience for theories on why something should have happened and yet didn’t.

They don’t want to accept a financial crisis type return in a year when there’s no financial crisis just because something happened in Asia or Europe that you didn’t foresee.

One of the more famous conviction stories is that of Michael Burry. It was memorably featured in the film The Big Short. Burry (played by Christian Bale) bought credit default swaps on subprime mortgage bonds. Doing this ensured Burry’s hedge fund performance was terrible for a considerable period of time due to the cost of holdings the swaps.

His investors were frustrated at the returns and apoplectic when Burry suspended redemptions and froze his investors’ capital until he believed the CDS market was acting as it should. If you’ve seen the film, Burry continually writes the percentage decline of his fund on a whiteboard.

In the end the payoff was spectacular. The number Burry finally wrote on his whiteboard was a two fingered salute to anyone who doubted him.

Michael Burry’s final return.

While it’s a great story, it’s not particularly helpful for everyday investors. In the film the audience is meant to sympathise, and cheer Burry on. In real life, the audience would be the investors screaming at Burry demanding their money back.

And for every Michael Burry who survived, recovered and delivered a monster pay off, there are an array of funds that have been shuttered after abysmal performance, the managers slinking off into the night. If an investor is down 20%+ in a fund based on a manager’s convictions, you can be assured they’re losing their convictions in the manager’s abilities.

Neil Woodford has been great in the past. Charlie Aitken has been great in the past. As we see time and again when it comes to investment returns, reputations mean nothing. Investors banking on previous conviction success won’t know the manager they’re investing with is right or wrong until after the fact.

Not that it stops the media giving them endless free publicity. Both Woodford and Aitken have been media darlings in their respective counties. In many investors’ minds media exposure equals skill and legitimacy when it’s only an indicator of the past and a willingness to provide a colourful quote.

But here’s a more important quote from some investors in Neil Woodford’s fund, “we trusted Neil Woodford with our money”.

Investors can trust a person, or they can trust capital markets and the factors that are known to drive returns. There are no guarantees, but in the past markets have been able to price in bad news and eventually keep providing returns.

The same can’t be said for every star manager’s fund.


Neil Woodford explains to his investors.

This represents general information only. Before making any financial or investment decisions, we recommend you consult a financial planner to take into account your personal investment objectives, financial situation and individual needs.

Filed Under: Uncategorized

November 16, 2018 by John Duncan

True Grit

How far do we get without commitment and perseverance? Any task we begin in life is going to require some commitment and perseverance if we wish to pursue it thoroughly. That commitment may begin early in life. As children, we may show an interest to pursue a particular sport or hobby, alternatively our parents may force us into various activities they think we should pursue!

How long any of these endeavours will last, largely depends on whether we find them fulfilling in some way or how much persistence we have. As children, we can be fickle. Toys can fly out of the cot over the slightest thing. We lack any real experience. Our inability to rationalise time or where resources come from, allow us to get away with being fickle. As a child we may well give something up at a moment’s notice or not find ourselves sufficiently motivated.

That luxury of having support provided for by parents instead of having to sweep chimneys for our keep is particularly valuable before we’re in the real world. It provides a platform to determine what we’d like to dedicate our time to. Hopefully a task rewarding enough in some way to remain motivated for.

The longer we are in the tooth, the less fickle we can afford to be. Commitment and perseverance become more important in achieving goals – as long as we’re actually on the right path. In the 2016 book, Grit: The Power of Passion and Perseverance, author Angela Duckworth challenges the idea that it’s talent that propels us towards success in life. Instead of talent, it’s grit that’s the most reliable predictor of success.

Duckworth developed her own questionnaire that measured this intangible thing called grit. Her questionnaire reliably predicted things such as who might graduate from West Point military academy, or the which competitors would get the furthest during the US National Spelling Bee.

What exactly was grit?

First, these exemplars were unusually resilient and hardworking. Second, they knew in a very, very deep way what it was they wanted. They not only had determination, they had direction.

And:

skipping around from one kind of pursuit to another—from one skill set to an entirely different one—that’s not what gritty people do.

When we’re investing, it’s no different. The primary hurdle is settling on an investment philosophy. Importantly, one that works and has evidence behind it. The second thing is sticking with it.

Investing is nothing to do with talent, nor are gains just handed out for making an appearance on the first day. You also don’t get the choice of when you show up to collect the gains before leaving again. If only it was that easy. No one can predict when they’ll appear – so it’s important that an investor be prepared to commit to a long-term endeavour and have the persistence to ride out all types of markets.

Often some of the best gains will come in short spurts, as the following chart shows. Take away the best day on the ASX 300 between 2001-2017 and the average annual return over that timeframe falls 0.35%. Take away the best five days between 2001-2017 and the average annual return falls 1.61%.


As the chart shows, if an investor starts with $1,000 in 2001, by 2017 they’ve left behind over $800 if they missed those best five days. That doesn’t seem a huge amount, but start with $100,000 and then it’s over $80,000 left on the plate. The ability to commit to the process and persevere provides rewards, you just don’t know when they’ll appear – that’s why perseverance is required.

When we look at returns on a monthly basis over the same time frame, we find that the majority of months are positive. Over 63% of the time, but there are some concerning outliers to the left.

asx 300 monthly returns

As you might expect, those three worst months came during the financial crisis. It’s never pleasant to see those sorts of declines are possible and it’s even less pleasant to experience them, but it’s important to acknowledge and understand they happen. It’s doubly important to understand they’re not fatal. The investors who doubted there would ever be a recovery after 2008 eventually lost their nerve and crystallised their loss at the worst possible time. When an investor encounters these periods, it is beneficial they have the grit required to emerge out the other side. It’s also important they understand their portfolio isn’t just their local equity index, holding a diversified portfolio means these months are never that extreme.

Is there anything else to be learned from the distributions of monthly returns? Well, some of the worst losses tend to cluster. There are sixteen instances of two or more consecutive negative months and six instances of three or more consecutive negative months. Is this an indicator of anything? Can you turn your mind to predicting the bad stretches, extending perseverance and grit to figuring out when to get out of the market ahead of the declines?

It would be folly to try. The last month of 2002 and the first two months of 2003 were all negative, surely that was the beginning of something bad? No, over the next 23 months, only three were negative. Or there was the last two months of 2011 which were negative. Maybe that would be the start of a bad run? Wrong again. There was only one negative month in the next fourteen.

As the old saying goes, “it’s time in the market, not timing the market that counts”. The gains are there, but it takes grit and perseverance to endure the declines, the volatility and the sometimes months of mundane sideways movement that will test an investor’s resolve.

This represents general information only. Before making any financial or investment decisions, we recommend you consult a financial planner to take into account your personal investment objectives, financial situation and individual needs.

Filed Under: Uncategorized

November 2, 2018 by John Duncan

Measuring the ASX

It’s often referenced, but few of us know what’s behind the number that’s quoted on the nightly news.

You might call the ASX or any other equity index somewhat of a living entity, it’s hopefully growing, but it’s definitely evolving. Equity indices will rebalance throughout the year, shedding some securities and replacing them with others.

On the ASX the rebalancing occurs on a quarterly basis, while at any time throughout the year there can be a deletion due, usually due to a merger. To make it in, the company or security needs to have an adequate market capitalisation over the previous six-month period – being within the largest 200 (give or take) securities on the market, while also meeting liquidity requirements.

In the last 18 months there’s been just over 40 additions with an equal number of deletions.

As with last time, by sector the financials make up the largest single part. Though as opposed to March 2016, their weighting has changed from 36% to 30% of the total.

inside the asx 200

As for companies as a whole, there are a few changes in the largest companies. Previously Commonwealth bank comprised just over 9% of the total index weight. Now that’s fallen to 7%. It’s a similar story for the big four as a whole, no longer do they comprise the largest four listed companies on the ASX 200. BHP and CSL have bumped ANZ and NAB from the top four, while BHP has bumped Westpac from second largest to third.

In terms of market capitalisations, the banks haven’t really given up a lot. It’s $7 billion off Commonwealth, but it’s BHP and CSL which have increased their market caps significantly to push the other banks aside.

inside the asx 200

Another casualty was Telstra. It was the fifth largest company in 2016, owing to some of its recent troubles it’s now fallen to the ninth largest. Losing around 26 billion from its market cap.

The barrier to entry is also higher in 2018 as you’d expect it to be, given the market is significantly than it was 18 months back. The smallest market cap in March 2016 was $304 million, it’s now $564 million. Also, back in 2016 Commonwealth was so large its market cap was bigger than the 104 smallest companies, by October 2018 it could only swallow the 83 smallest companies.

So the biggest aren’t getting bigger, but smallest are catching up.

What’s to be learned here? As always diversification. 40 securities departed for various reasons. How does anyone know ahead of time who will be coming or going, while the banks went nowhere, but the ASX 200 continued to grow.

Diversification is more than just one country or one index. Here, we’re still significantly dominated by our banks. It’s important to look beyond our shores because capitalism is still doing its best to provide growth around the globe.

This represents general information only. Before making any financial or investment decisions, we recommend you consult a financial planner to take into account your personal investment objectives, financial situation and individual needs.

Filed Under: Uncategorized

October 19, 2018 by John Duncan

2018 September Quarter review

Economic Overview

Economic growth and earnings data remained robust during Q3, and this ultimately overshadowed simmering concerns around the escalating US-China trade war. The US initially targeted $34 billion of Chinese products with a 25% tariff in early July, while monetary policy tightened in the US. Markets were mostly positive in developed countries, but there was significant volatility in some emerging markets. Commodities struggled against a strengthening US dollar, while energy continued to rise with the prospect of sanctions on Iran.

In the US, ongoing growth and strong employment figures allowed the Federal Reserve to increase the federal funds rate by 25 basis points. The committee also dropped its long-standing description of monetary policy as “accommodative”, reaffirming an outlook for ongoing hikes in 2019. Data released in September showed wages to be growing at the fastest rate since 2009, while industrial activity indicators show little impact from the trade wars.

Fiduciary Financial Advice Australia.

In the EU, fears over trade impact on Europe were calmed following a meeting in July between US President Trump and EU President Juncker. From this came an agreement to work towards zero tariffs on non-auto industrial goods, while new car tariffs were put on hold. Growth for the second quarter was revised up to 0.4% quarter-on-quarter, compared to the initial estimate of 0.3%.

In the UK fears for the economy were reflected in the value of the pound, which resumed its downward trajectory over the period. However, the outlook for the domestic economy improved, as growth recovered from the slow first quarter, prompting the Bank of England (BoE) to increase interest rates by 25 basis points.

In Asia, Japanese company profits continued to improve. Economic growth rebounded strongly from the short-term weakness seen in Q1 and corporate sentiment remained relatively firm given the tightness in the labour market and the uncertain global outlook. Meanwhile, Chinese macroeconomic data disappointed as they retaliated against US trade tariffs. Authorities announced a range of targeted economic support measures, including fiscal stimulus and credit easing. The central bank also re-introduced macro prudential measures to stabilise the renminbi.

In Australia, it was much the same as Q2, as the Reserve Bank continued to hold the cash rate, while house prices continued to fall as tighten lending conditions influenced mortgage lending and real estate, particularly in Sydney.

Market Overview

Asset Class Returns

The following outlines the returns across the various asset classes to the 30th September 2018.

Fiduciary Financial Advice Australia.

Global equities gained in Q3, primarily due to US market strength. Political uncertainty and trade concerns weighed in other regions. US equities significantly outperformed other major markets. Economic growth and earnings data remained extremely robust, ultimately overshadowing concerns surrounding the escalating US-China trade war. The US equity bull market became the longest in history on August 22.

Eurozone equity gains were modest with the MSCI EMU index returning 0.4%. Energy and industrials were the leaders. Financials made a good contribution despite weakness in the banking sector amid concerns over exposure to emerging markets as well as worries over the Italian budget.

The UK’s FTSE All-Share fell 0.8% over the period. The Bank of England increased base rates and sterling fell in response to political noise around Brexit. Any slowdown in global growth and trade tends to have an outsized impact on emerging markets and emerging market exposed areas of the UK stock market, including financials and miners, performed poorly as a consequence.

Although trade tensions continued to escalate during the quarter, the Japanese stock market ended September above its recent range to show a total return of 5.9% for the quarter.

Emerging markets equities lost value in what was a volatile third quarter, with US dollar strength and the US-China trade dispute weighing on risk appetite. The MSCI Emerging Markets index decreased in value and underperformed the MSCI World.  By contrast, Thailand recorded a strong gain and was the best performing index, with energy stocks among the strongest names. Mexico outperformed as the market rallied following general elections and an agreement with the US on NAFTA renegotiation.

Fiduciary Financial Advice Australia.

Australia’s performance was relatively good across the quarter given the attention focused on some of the ASX’s largest companies. The banking royal commission has been felt acutely by shareholders of Australia’s big four banks throughout 2018, though there was a mild recovery between the end of Q2 and the beginning of Q3.


Strava Theft

Finally, not exactly related to investing or finances, however a story on why it’s always important to be aware of what you’re sharing online or with anyone who may call you fishing for information.

If haven’t heard of Strava, it’s a fitness network that allows you to track your cycling, running or swimming activities using GPS data. The users can upload the data from their activities, which includes distance traveled, pace, speed and elevation, along with heart rate. This allows the users to track and compare their data with that of other users. If you’re someone who is training alone it may provide an useful way to challenge yourself in your training. There are also challenges built into the system.

Of course whenever there’s data available, some nefarious party is liable to make something of it. At least that’s what UK cyclist Adam Jones thinks.

An Essex man who had £12,500 worth of bikes stolen from his home has warned cyclists to be careful of what they post on social media. Adam Jones believes thieves may try and identify riders who record fast times on Strava segments and he expressed regret that he had not been more cautious regarding the information he shared online.

It may be a leap to suggest he was targeted because he was posting fast times, but it seems he hadn’t been as vigilant with his privacy as he should. People often link accounts and for the determined thief, it’s likely a small effort to case out Strava, Facebook or Instagram and find a person with a picture of their expensive bike and then find out where they live. As for Strava, what can they say, but suggest users be more aware of what they’re sharing on social media.

“Strava hasn’t seen any verified cases of bicycle theft related to our platform. However, we encourage all of our members to be aware of what they share on all types of social media. Our platform has a suite of tools to help control what you share, including privacy zones, which will hide the start and end points of your activity if they fall within the zone.”

Of course this is nothing new, thieves have in the past used Facebook or the classifieds to hunt down things they wanted to steal, it’s always best not to leave a trail of breadcrumbs and make it easier for them.

Any information can be dangerous in the wrong hands, be careful what you’re putting out there!


With thanks to Schroders & DFA Australia

This material is provided for information only. No account has been taken of the objectives, financial situation or needs of any particular person or entity. Accordingly, to the extent that this material may constitute general financial product advice, investors should, before acting on the advice, consider the appropriateness of the advice, having regard to the investor’s objectives, financial situation and needs. This is not an offer or recommendation to buy or sell securities or other financial products, nor a solicitation for deposits or other business, whether directly or indirectly.

Filed Under: Uncategorized

September 7, 2018 by John Duncan

What is Balanced?

In a recent article in Professional Planner John Peterson of Peterson Research Institue lined up the performance of Australian Super’s actively managed balanced fund and compared it to Australian Super’s lower cost indexed diversified fund to make the case that active management is the true gold standard.

Something ignored, possibly to achieve the exact conclusion reached, was the difference in asset allocation between the two funds. The active and better performing fund had a very aggressive portfolio mix with almost 85% growth assets. The index diversified fund had just under 70%.

No shock that a more aggressive portfolio mix would outperform a less aggressive peer, regardless of active or passive. That aside, it was during the research that we noticed how far the balanced fund in Australian super had lurched into growth assets.

Ask the average person and they’d probably assume a balanced portfolio was split half and half between growth and defensive assets. In the financial world, there’s a little more flexibility in the definition. Using 60-70% growth assets and 40-30% defensive assets as the definition. However, 85% in growth was a level we’d never seen before.

And it wasn’t uncommon. When super returns were released for the 2017/18 financial year last month Hostplus was sitting at the top of the pack. When their Chief Investment Officer was interviewed by The Australian, he spoke of the Hostplus asset allocation:

It has a zero allocation to cash and a 2 per cent allocation to fixed interest that it would also soon move to zero, Mr Sicilia said.

This would mean Hostplus is running with 100% growth assets. No other way of stating it – 100% growth assets is not a balanced fund. We’ll credit adviser, Marshall Brentnall, who got back on this issue quicker than we did for a good definition on this:

The traditional view, and in my view the correct one, is that defensive assets should be limited to cash and fixed income, such as bonds and debt. There should be no reference to property, infrastructure or private equity as these are assets that will grow in value over time.

Go over to UniSuper, and by the diagram below it shows they’re defining asset classes along these traditional lines. Cash and fixed interest are defensive, while property shares and alternatives are growth. Alternatives are infrastructure and private equity, both generally being unlisted.

Yet at Hostplus things seem a little more flexible.

Possibly defining why they’re aiming to have zero cash and fixed interest in their ‘balanced’ fund. They’re squeezing out the genuinely defensive assets, to replace them with their own definition of defensive. Doing this allows them to reap the rewards of being the top performing ‘balanced’ fund. Being the top performer comes with inbuilt media coverage throughout the next year.

Wall to wall media attention and plaudits aren’t a bad thing when you’re trying to attract more members to your fund. And it’s not like journalists are going to spell this stuff out. They’re more interested in a straight returns table without taking account of the asset allocation underneath.

As Mr Brentnall further noted, if property, infrastructure and private equity were classified as growth assets across the board, only 3 of this year’s top 10 performing superfunds could be considered balanced using a criterion of 60-76% growth assets.

The returns are great, but there are implications here. There has been talk of setting up a top performers list at initial superfund signup. People would choose from a list of funds an independent panel determine to be the best options available. There’s also the bigger issue members are also taking on substantially more risk without understanding they’re doing it.

But they’re in the balanced fund, right? What could be safer than that?

This represents general information only. Before making any financial or investment decisions, we recommend you consult a financial planner to take into account your personal investment objectives, financial situation and individual needs.

Filed Under: Uncategorized

August 2, 2018 by John Duncan

2018 June Quarter Review

Economic Overview

Global economic data proved resilient during Q2 though it was offset by renewed geopolitical tensions. Equity markets were volatile, but mostly positive, while the potential for a trade war between the US and China turned into a reality, while the Trump administration withdrawing from the Iran nuclear accord contributed to higher energy prices.

In the US, consumer confidence remained strong with retail sales data suggesting a consumption rebound after a softer Q1. The unemployment rate also reached an 18-year low of 3.8%, accompanied by robust wage growth. The Federal Reserve raised the target rate for Fed Funds by 0.25% and marginally increased its 2018 forecasts for growth and inflation.

The positive US economic data was balanced by moves from the Trump administration to impose tariffs on Chinese imports and withdraw from the Iran nuclear accord. In combination, these steps amounted to a more combative trade posture from the US, driving oil prices higher, and weighing on longer-term growth expectations.

In the eurozone the quarter was marked by the return of political risk. Markets feared Italy may need fresh elections following an inconclusive outcome in March, with concerns this would become a referendum on Italy’s membership of the euro. However, a governing coalition was eventually formed between populist parties. Spain also saw a change of government, although this was largely greeted with calm, while German Chancellor Angela Merkel clashed with sister party the CSU over immigration.

Economic data from the eurozone pointed to steady growth but at a slower pace than last year. GDP growth for the first quarter was down to 0.4%. The European Central Bank (ECB) announced that it expects to end its quantitative easing programme in December 2018. The ECB added that interest rates will remain at current levels through the summer of 2019.

In the UK the Sterling performed poorly after the Bank of England backed away from a much-anticipated rate rise (in contrast to an increasingly hawkish US Fed). This followed with a flow of disappointing macroeconomic data, which culminated in the Bank reducing its 2018 growth forecasts – it is now expecting the UK economy to expand by 1.4% this year, versus 1.8% previously.

In Japan, economic indicators pointed towards a recovery from the GDP decline seen in the first quarter. Data released at the end of June provided some positive surprises with industrial production and inflation data for Tokyo both ahead of expectations. The strength of the labour market is nothing new, but a decline in Japanese unemployment to 2.2% was viewed as positive for inflationary expectations.

Asia ex Japan saw positive developments with regards to peace on the Korean peninsula. An Inter-Korea Summit saw leaders from the South and North pledge to agree a formal end to the war between the two sides. US President Trump subsequently met with North Korean leader Kim Jong-un in Singapore in June. In China, the central bank cut the reserve ratio requirement for banks by a total of 1.25% over the quarter to encourage lending and support growth

In Australia, the Reserve Bank continued to hold the cash rate at 1.5% as macroprudential policy and the spectre of the banking Royal Commission continued to influence mortgage lending and real estate market.

The Bloomberg Commodities index posted a slightly positive return in Q2. Crude oil prices continued to rally, with President Trump’s decision to withdraw the US from the Iran nuclear accord, despite OPEC announcing plans to boost supply. The industrial metals index registered a small gain. Nickel (+11.9%) and aluminium (+8.4%) were firmly up while zinc (-11.5%) and iron ore (-1.7%) lost value.


Market Overview

Asset Class Returns

The following outlines the returns across the various asset classes to 30th June 2018.

Global equities made gains in a volatile quarter, as resilient economic and earnings data vied with an unsettling geopolitical backdrop to establish the market’s direction. Bond markets struggled despite risk aversion escalating late in the quarter.

US equities advanced in Q2, with positive earnings momentum and supportive economic data ultimately overcoming US-China trade concerns Over the quarter, energy, consumer discretionary and technology stocks performed well, while a rotation into more traditionally defensive areas supported real estate and utilities.

Eurozone equities posted positive returns in the second quarter. Top performing sectors included energy, information technology and healthcare. Financials were the main laggards, posting a negative return; Italian banks struggled amid political uncertainty. Auto stocks fell with intensifying trade concerns as US President Trump threatened tariffs on imported vehicles.

UK equities bounced back as international investors reduced their underweight in the country, albeit sentiment towards the UK remains extremely negative. Prior to the period under review, the UK’s unpopularity with international investors had hit levels not seen since the global financial crisis.

While Japan eeked out a 1.1% gain for the quarter the rest of Asia was firmly down in Q2 with global trade concerns serving to increase risk aversion. The MSCI Asia ex Japan Index generated a negative return and underperformed the MSCI World.

Emerging market equities recorded a sharp fall in Q2 with US dollar strength a significant headwind. Escalation in global trade tensions also contributed to risk aversion as US-China trade talks failed to deliver a sustainable agreement. Meanwhile the US moved to extend steel and aluminium tariffs to the EU, Canada and Mexico, resulting in the announcement of retaliatory measures. The MSCI Emerging Markets Index recorded a negative return and underperformed the MSCI World.

Australia was one of the best performing developed markets, despite weakness in heavyweight financial stocks and Telstra. Energy was one of the standout sectors locally and globally, supported by healthcare, consumer staples and IT. In developed markets, listed property was also a notable positive performer.


With thanks to Schroders & DFA Australia

This material is provided for information only. No account has been taken of the objectives, financial situation or needs of any particular person or entity. Accordingly, to the extent that this material may constitute general financial product advice, investors should, before acting on the advice, consider the appropriateness of the advice, having regard to the investor’s objectives, financial situation and needs. This is not an offer or recommendation to buy or sell securities or other financial products, nor a solicitation for deposits or other business, whether directly or indirectly.

Filed Under: Uncategorized

  • « Previous Page
  • 1
  • 2
  • 3
  • 4
  • 5
  • …
  • 9
  • Next Page »

Keep up to Date

Powered by VMA-Emailer

Meet John Duncan

John Duncan - Financial Planner

Director for True Financial - John Duncan - Fee Only financial planner To receive the best financial planning advice you need the best financial planner. John Duncan is certainly in that category. John is a financial planner who is unique in not only his high level of knowledge and experience in financial planning but also in the amount of areas that John advises in. A Financial Planner with a strong Education background John is a Certified … Read More

Post Categories

  • Budget (5)
  • General (27)
  • Insurance (2)
  • Investment (14)
  • Property (5)
  • Superannuation (4)
  • Tax Tips (7)
  • Uncategorized (50)

Like us on Facebook

Recent Posts

  • 2025 Q2 June Quarter Review
  • Don’t Vote with your Portfolio
  • Investing Has Been Solved
  • John Hussman: Man Who Predicted…
  • Bank Runs

Privacy Statement

See our Privacy Statement here

Keep up to Date

Powered by VMA-Emailer

True Financial is an Authorised Representative No. 428771 and Credit Representative No. 428873 of FYG Planners Pty Ltd, AFSL/ACL No. 224543. ABN 29 009 541 253

Contact Information: Address: 23 Errard St Kelvin Grove 4059 - Phone: (07) 3169 2570 - Email: admin@truefinancial.com.au - Web Design & SEO by: Visual Marketing

Information provided on this website is general in nature and does not constitute financial advice. True Financial Pty Ltd will endeavour to update the website as needed. However, information can change without notice and True Financial Pty Ltd does not guarantee the accuracy of information on the website, including information provided by third parties, at any particular time. Every effort has been made to ensure that the information provided is accurate. Individuals must not rely on this information to make a financial or investment decision. Before making any decision, we recommend you consult a financial planner to take into account your particular investment objectives, financial situation and individual needs.True Financial Pty Ltd does not give any warranty as to the accuracy, reliability or completeness of information which is contained in this website. Except insofar as any liability under statute cannot be excluded, True Financial Pty Ltd, its employees do not accept any liability for any error or omission on this web site or for any resulting loss or damage suffered by the recipient or any other person. Unless otherwise specified, copyright of information provided on this website is owned by True Financial Pty Ltd. You may not alter or modify this information in any way, including the removal of this copyright notice.
Manage Cookie Consent
To provide the best experiences, we use technologies like cookies to store and/or access device information. Consenting to these technologies will allow us to process data such as browsing behavior or unique IDs on this site. Not consenting or withdrawing consent, may adversely affect certain features and functions.
Functional Always active
The technical storage or access is strictly necessary for the legitimate purpose of enabling the use of a specific service explicitly requested by the subscriber or user, or for the sole purpose of carrying out the transmission of a communication over an electronic communications network.
Preferences
The technical storage or access is necessary for the legitimate purpose of storing preferences that are not requested by the subscriber or user.
Statistics
The technical storage or access that is used exclusively for statistical purposes. The technical storage or access that is used exclusively for anonymous statistical purposes. Without a subpoena, voluntary compliance on the part of your Internet Service Provider, or additional records from a third party, information stored or retrieved for this purpose alone cannot usually be used to identify you.
Marketing
The technical storage or access is required to create user profiles to send advertising, or to track the user on a website or across several websites for similar marketing purposes.
Manage options Manage services Manage {vendor_count} vendors Read more about these purposes
View preferences
{title} {title} {title}