Federal Budget 26/27
The Federal Budget has arrived and we’re back in deficit territory for 2026-27, with an underlying cash deficit around $31.5 billion. Slightly better than some earlier forecasts thanks to commodity revenue, but the forward estimates show ongoing deficits stretching out, pushing gross debt over the $1 trillion mark and heading towards $1.2 trillion by the end of the decade.
As usual, the headlines were leaked and framed around the classic winners/losers narrative, but for the capital gains tax, while the leaks seemed less than positive, the reality of the proposed changes were worse than expected.
Forecasts beyond the next quarter or two should still be viewed with healthy skepticism. The budget forecasts for inflation were back to 2.5% for the next three financial years, which doesn’t seem plausible at all. And take the Iran war excuses with a grain of salt, inflation was already on the move upward in Australia prior to the first missiles being launched.
It is important to remember much of what is discussed here is still proposed, and may be amended, deferred or simply not occur as it goes through the legislative process. Final legislation may differ from budget announcements.
The CGT Changes
From 1 July 2027, the 50% Capital Gains Tax discount will be replaced by cost base indexation for assets held for more than 12 months. In addition, a 30% minimum tax will apply to net capital gains. The Government confirmed that these changes will apply to all CGT assets and they’re also coming for pre-1985 CGT assets, held by individuals, trusts and partnerships.
Indexation will be calculated using Consumer Price Indexation (CPI) in a similar way to the rules that previously applied between 1985 and 1999. Bear with us, but this essentially means there are four asset acquisition brackets.
Pre 1985.
Post 1985 to 21/9/1999.
Post 21/9/1999 to 30 June 2027.
Post 1 July 2027.
Gains accrued up until July 1, 2027, will remain taxed at their current rules, but gains accrued after 1 July 2027 will be subject to the indexation method after 12 months and taxed at a minimum of 30%. All these rules should keep the accountants in business.
Going forward the 30% minimum is particularly sinister because it is designed to stop people deferring the sale of their assets to a time when they have lower taxable income to minimise their tax bill.
Who could be hit by this? Someone who becomes unemployed, isn’t eligible for a support payment and plans to use either shares, managed funds, or ETFs to cushion any long-term unemployment blow. Similarly, anyone planning to early retire pre superannuation preservation age and use the sale of assets to fund their early retirement has had their plans upended. Without an income, currently any sale of assets would be assessed at a lower rate.
As a basic example, someone with $50,000 of capital gains and no other income would currently pay $6,538 if held for 12 months. For an asset acquired Post 1 July 2027 and held for 12 months that would become a $15,000 tax bill. The only exception is if someone is receiving a means tested income support payment such as the age pension or jobseeker.
As there has already been some confusion floating around out there: these CGT changes do not apply to superannuation.
Finally, investors in new build residential properties will be able to choose either the 50% CGT discount, or cost base indexation and the minimum tax.
The budget pitch was inter-generational fairness and ensuring young people can compete in the housing market, but if that’s the case one might ask why do CGT changes capture every asset class, instead of solely targeting housing investment?
Negative Gearing
The Government has announced it will quarantine negative gearing for residential property to new builds. From 1 July 2027, losses from established residential properties will only be deductible against rental income or the capital gains from residential properties. Excess losses will be carried forward and are able to be offset against residential property income in future years.
For established residential properties:
Properties held at announcement will be exempt from the changes until disposed of.
Properties purchased between the announcement and 30 June 2027 may be negatively geared during this period, but not from 1 July 2027.
Properties purchased from 1 July 2027 will not be able to be negatively geared.
New builds can continue to be negatively geared before and after 1 July 2027.
New build residential properties include:
Dwellings constructed on vacant land, or where existing properties are demolished and replaced with a greater number of dwellings.
Knock-down rebuilds or substantial renovations that do not increase supply will not qualify as new build residential properties.
Subsequent purchasers of the dwelling will not be able to access the negative gearing.
The combination of changes to both capital gains tax and negative gearing will likely mean an increase in SMSFs targeting existing property.
Minimum Tax on Discretionary Trusts
From 1 July 2028 the Government will introduce a 30% minimum tax rate on the taxable income of discretionary trusts. The tax will be paid by the trustee of the trust as it controls the distributions. Beneficiaries will then need to declare their trust income in their tax return, but beneficiaries, other than corporate beneficiaries, will then receive a non-refundable tax credit for the tax payable by the trustee. This has been used to income split with lower rate beneficiaries and about 5% of individual taxpayers received distributions in 2022/23.
The Government has confirmed the minimum tax will not apply to fixed and widely held trusts (including fixed testamentary trusts), complying superannuation funds, special disability trusts, deceased estates and charitable trusts.
Other Tax Changes
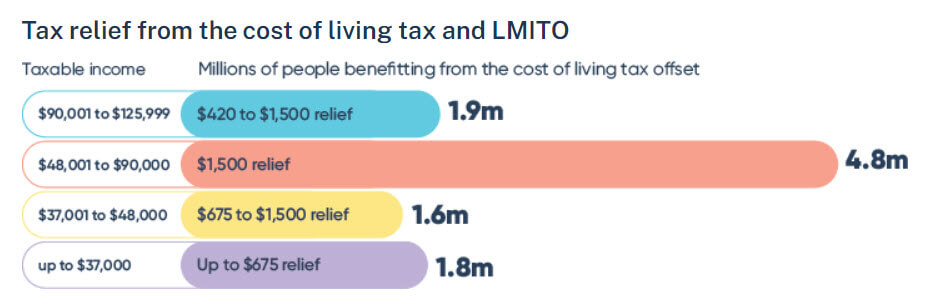
The government has rolled out some personal tax relief, with every taxpayer getting an extra cut of up to $268 from 1 July 2026, rising to $536 from 2027. Lower and middle income earners see the biggest proportional benefit, including a new permanent $250 Working Australians Tax Offset kicking in later. There’s also a $1,000 instant deduction for work-related expenses without the usual receipt hassle.
On the investment and business side, the $20,000 instant asset write-off for small businesses (turnover under $10 million) has finally been made permanent, a welcome extension that should help with equipment and tech investment. Loss carry-back has been reintroduced, letting companies offset current losses against profits from the previous two years, and there’s new loss refundability for start-ups to ease early cashflow pain.
Housing
There’s a new $2 billion Local Infrastructure Fund to unlock essential services for new developments, aiming to support up to 65,000 extra homes over the decade. Combined with other spending, the government claims it’s ramping up to record housing investment levels.
The foreign buyer ban on established homes has been extended to mid-2029, keeping more stock theoretically available for locals. Renters and social housing get some attention, but with vacancy rates still tight in many cities, the real test will be whether supply catches up. Critics are already warning that hitting investor incentives could push rents higher while slowing price growth for everyone else.
Pension Supplement
Pensioners receive a slight tweak to the Pension Supplement. From September 2026, the full rate will be paid for up to 12 weeks of overseas travel (up from 6 weeks), but it drops to zero after that and is removed entirely for those living permanently overseas. The government is framing it as better targeting and savings, which will help some travellers but sting frequent or long-stays
Private Health
The government is cutting the higher private health insurance rebate currently available to those aged 65 and over. From 1 April 2027, older Australians will shift to the standard rebate rate, pushing up out-of-pocket premiums for many. The savings are being redirected into aged care.
Aged Care
Aged care gets a solid injection with $3.7 billion earmarked over coming years for extra residential beds, faster access to Support at Home packages, and making personal care services free for recipients. There are also new capital incentives to encourage providers to build.
Electric Car FBT
The full FBT exemption for electric vehicles is being wound back. It stays fully intact until March 2027, then shifts to a 25% discount on more expensive models from April 2027, with everything moving to a permanent 25% discount by 2029. Existing deals are grandfathered. The free ride on luxury EVs is ending, though more affordable ones still get decent support plus some charger funding.
Immigration
Always interesting to look at the budget’s net overseas migration numbers by forecast and reality. Especially as the government has claimed housing is their focus, yet one thing they constantly ignore is the demand their policies place on housing.
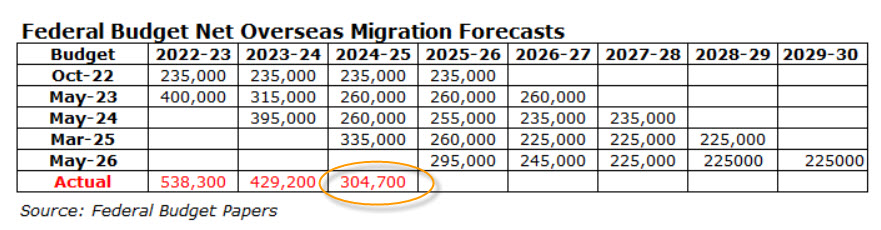
As you can see from the table, the numbers in the first two columns continually get revised upward before undershooting the actual figures. Cynics may note a large upward revision in March 25, which then made the 2024/25 number conveniently appear as though it came in low! What effect does all this have in the real world?
National rental vacancy rates tell the story. Note the sharp drop in vacancies from 2022.
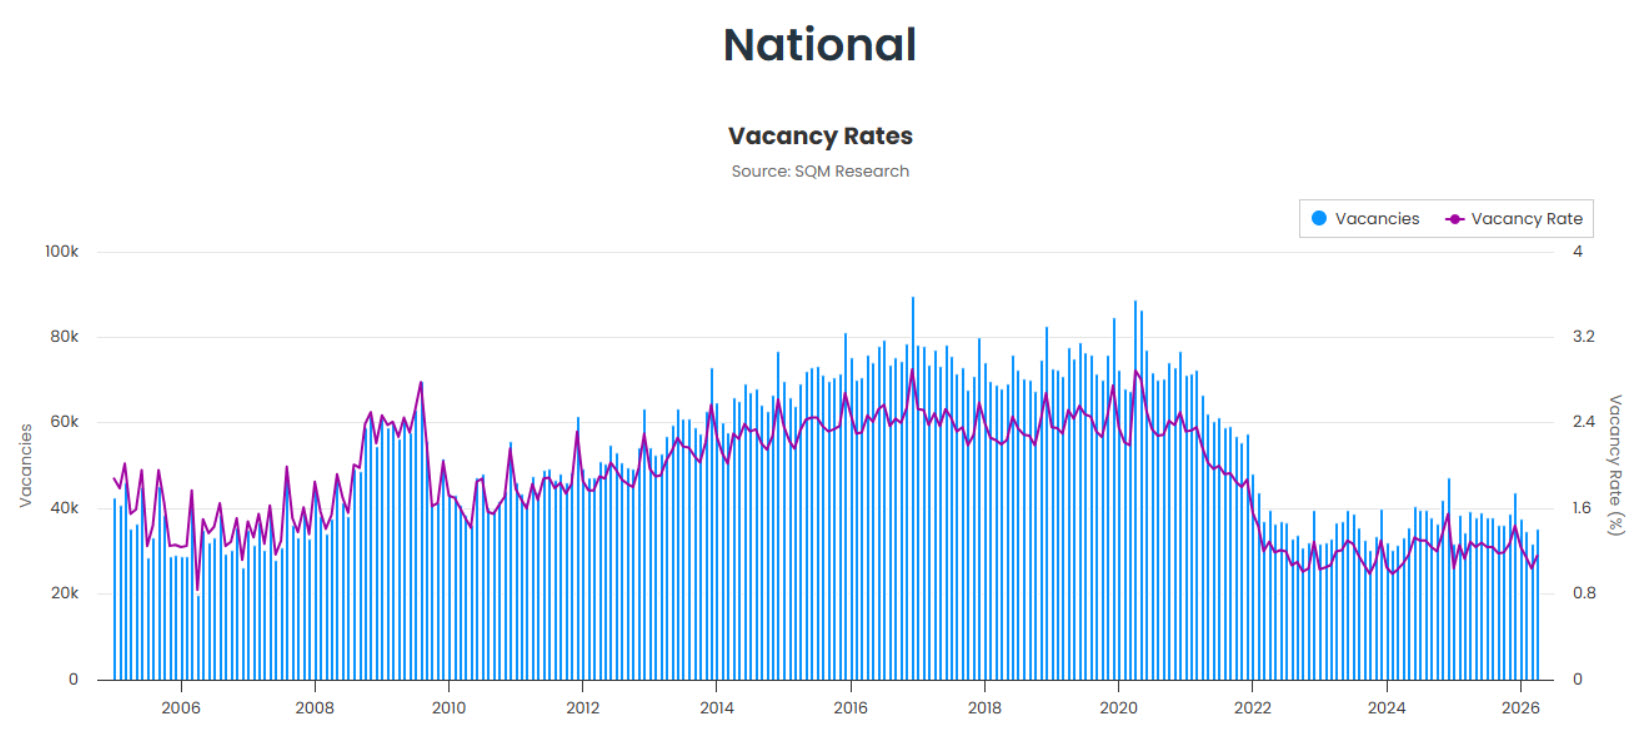
You’d hate to be a renter in Australia!
This represents general information only. Before making any financial or investment decisions, we recommend you consult a financial planner to take into account your personal investment objectives, financial situation and individual needs