Economic Overview
Tariff concerns initially ruled the roost in Q2 2025, before somewhat fading into the background. In contrast to Q1, there was a strong bounce for stockmarkets, as President Trump’s announced tariffs quickly became suspended tariffs. Again, raising the question, are President Trump’s tariffs actually about tariffs, or in some cases, are they leverage to secure other outcomes favourable to the US? The bluster and then delay of tariffs in some instances has prompted the acronym “TACO” (Trump Always Chickens Out), however some allies are starting to heed Trump’s calls for higher defence spending. While tariffs bubbled in the background for most of the quarter, the focus turned to interest rates again and the sustainability of the debt load the US is carrying. Despite a sharp “liberation day” tariff dip, the Australian dollar continued to strengthen against the US dollar throughout the rest of the quarter as US debt came into focus. Debt and the “one big beautiful bill” also caused a split in the eventful Donald Trump/Elon Musk friendship. Q2 was another favourable one for emerging markets as weakness in the US dollar provided a welcome tailwind.
In the US, GDP came in at an annualised rate of -0.5% for Q1 2025, the first negative figure since 2022. While this was weaker than initially expected, due to some revisions in consumer spending and exports, the largest contributor to the negative number was due to surging imports (which subtract from GDP). The increase in goods imports, up 38%, occurred due to concerns around tariffs. Business was madly stockpiling inventory ahead of anticipated tariff announcements. Consumer spending grew by 0.5%, the slowest rate since Q1 2019. As expected, federal government spending decreased by -4.6%, the largest fall since Q1 2022. Conversely, fixed investment increased by 7.6%, which was the largest increase since mid 2023.
Some trade news came in June, first a deal with the UK confirmed mid month, and in late June the US and China confirmed a trade framework to allow rare earth exports and easing of tech restrictions. Progress with other trade partners, the EU and Japan specifically, remained uncertain with a July deadline for the 90 day postponement of reciprocal tariffs. This uncertainty is likely to hinder GDP growth in the coming quarters.
The labour market has remained resilient despite policy uncertainty. There are several reasons for this. Some companies are adopting a “no-hire, no-fire” approach due to market tightness, the strength in consumer spending, and the performance of the defense and health care sectors. Another 147,000 jobs were added in June, with the unemployment rate slightly lower at 4.1%.
CPI came in at 2.4% in May, slightly up on 2.3% in April, which was the U.S. economy’s lowest inflation figure since February 2021. Regardless of the measurement, core or all items, it’s still persistently above the Federal Reserve’s 2% target level, however, transportation services and shelter, have declined significantly. These are typically sticky categories, and have kept inflation elevated even as goods inflation has continued to ease over the past year. The Fed maintained its target rate at 4.25% to 4.5% for the fourth consecutive meeting. This pause, following three rate cuts in late 2024, indicates the Fed is vigilant about potentially resurgent inflation while keeping an eye on broader economic conditions, along with the uncertainty of tariffs, which would apply upward pressure on prices and hit growth.
Other points of US interest during the quarter: the “one big beautiful bill” which caused the one big split between Donald Trump and Elon Musk. The bill includes several provisions that will affect the economy for years to come. The most significant are the extension of personal tax cuts from the 2017 Tax Cuts and Jobs Act. While the administration plans to offset revenue losses with cuts to health care and nutritional programs, environmental tax credit reforms and tariff revenues, the Congressional Budget Office estimates the bill will increase the federal deficit by $3.4 trillion over the next decade. Moody’s also downgraded the US credit rating during the quarter, making it the last major ratings agency to remove the Aaa rating.
By June, US housing inventory had increased by 27.7% over the previous year. This was the 83rd consecutive week of inventory growth and the highest percentage increase since the housing bubble back in 2006. While for sale signs have been increasing, many homeowners have been holding off selling due to ultra-low mortgage rates they secured during the pandemic. Selling would mean a new mortgage at 6% to7%. Finally, the dollar experienced a large sell-off in April due to uncertainty surrounding US policymaking, with the US dollar index down 10.7% for the year.

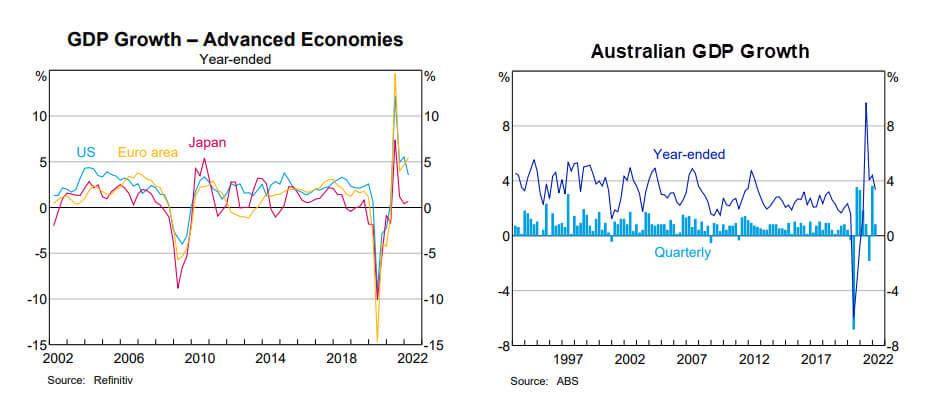
Source: RBA 2025
In the Eurozone, the European Central Bank cut interest rates twice in the period, by 0.25% each time. ECB President Christine Lagarde said that the central bank had “nearly concluded” its rate-cutting cycle. Eurozone CPI decreased to 1.9% year on year in May 2025, down from 2.2% in April and below market expectations of 2%. This is the first time inflation has fallen below the ECB’s 2% target since September 2024. This was influenced by a sharp slowdown in services inflation, which dropped to 3.2% from 4% in April, the lowest level since March 2022. Eurozone Manufacturing PMI moved higher to 49.5 in June, up from 49.4 in May. While a positive, a figure below 50 still represents a contraction, and PMI has been in contraction for some time now, but the figure has been consistently inching back toward 50 throughout 2025. There was also further progress in Q2 regarding Europe increasing its defence spending. While the US has been pushing for a 5% of GDP target, NATO offered 3.5% of GDP on “hard military”, with an additional 1.5% for infrastructure related spending to accommodate military convoys and movements. Cybersecurity and advanced tech for weapons would also fall under the 1.5%.
In the UK, the Bank of England cut interest rates by 0.25% to 4.25% in May, despite inflation remaining above the bank’s 2% target. Inflation came in at 3.4% in May according to the Office for National Statistics. The UK economy expanded 1.3% year-on-year in the first quarter of 2025, against 1.5% in Q4. The services sector grew 1.4%, with construction growing 1.2% while the production sector stalled. On the expenditure side, household spending rose 0.9% while business investment spiked 6.1%. The ongoing economic and social malaise in the UK has been evident in political polling since the last national election, with the governing Labour party and the Conservative opposition both on the nose. In May, voters took their cricket bats to local council elections, with Nigel Farage’s Reform Party winning the most seats, 41% of the 1641 seats available, and taking control of a number of local authorities. The Labour Party and the Conservative Party saw historic losses of their vote share.
In Japan, Q1 GDP came in at 1.7% on an annual basis, but was flat 0%, on a quarterly basis, though this was ahead of a forecast -0.2%. Private consumption was revised slightly higher to a 0.1% gain for the second consecutive quarter, reflecting government efforts to cushion the impact of rising food prices, specifically rice and higher energy costs. Business investment strengthened, expanding 1.1% and up from 0.6% in the last quarter, while government spending fell by -0.5%, marking its first decline in five quarters. Inflation remains persistent, hitting a more than two year high, with core CPI up 3.7% in May, and well above the BoJ’s 2% target.
In China, GDP growth for Q1 came in at 1.2%, making it eleven consecutive periods of quarterly growth. The year-on-year figure for Q1 held at 5.4%, which was above market expectations of 5.1%, showing Chinese growth has been resilient, mostly stemming from productivity improvements and rising consumer spending. Obviously, some of the bigger news for the quarter revolved around trade and tariffs. US imports from China dropped to $24 billion in April, this was the lowest since 2010 if the early pandemic months are excluded. Ongoing trade tensions and higher tariffs will continue to affect external demand. Although tensions have eased, tariffs on Chinese imports to the U.S. will remain higher than at the start of the year. For its own part, China has started to exempt a quarter of US goods from tariffs, with a list of exempted products circulating in early May. The People’s Bank of China reduced borrowing costs by 0.1% in May to help offset the impact of new US tariffs.
In Asia (ex-Japan & China) and Emerging markets, the quarter saw a sharp jump in the Taiwanese dollar, which was partly a result of exporters selling some US dollar assets. Core inflation held above 5% in Brazil during Q2, while year on year GDP was down to 2.9% in Q1 vs 3.6% in Q4 24. The Central Bank of Brazil hiked its Selic rate by 0.25bps to 15% at its June meeting, this followed a 0.50% hike in May. The board cited persistent inflation, but signaled this may be the last hike in the current cycle, which has seen rates move up 4.5% since September 24. Year on year GDP growth in India came in at 7.4% for Q1, significantly up on the 6.4% figure of Q4 24, as lower food and energy prices, along with improved eased benchmark interest rates helped growth. Indian CPI eased for the seventh straight month, down to 2.82% in May. In South Korea, political instability subsided following the election of a new president in June, Democratic Party candidate Lee Jae-myung.
Back in Australia, data released in June showed GDP increasing by 0.2% for Q1 2025. Year on year GDP growth end of Q1 sat at 1.3%, the same as the prior quarter, but below expectations of 1.5%. GDP per capita, noted as a proxy for living standards, went back into negative territory, sliding -0.2% for the quarter, and -0.4% year on year. Inflation increased 0.9% in Q1 2025 and came in at 2.4% for the 12 months ending March 25, and above expectations of 2.4%. The April and May 25 monthly figures came in at 2.4% and 2.1% respectively. Food and non-alcoholic beverages slowed to their lowest movement in five months, at 2.9%, as there was a significant slowdown in fruit and vegetable prices. Inflation eased for housing at 2.0%, and for recreation and culture at 1.4%. Inflation accelerated for alcohol and tobacco, clothing inflation also increased, while health at 4.4% and education at 5.7% were steady.
The RBA cut rates following its April meeting, and in its statement noted “the risks to inflation have become more balanced. Inflation is in the target band and upside risks appear to have diminished as international developments are expected to weigh on the economy.”
As always in Australia, an interest rate cut was immediately taken as a positive for real estate, and auction clearance rates saw a jump. House prices increased in every market over Q2 25, except for regional Tasmania. The combined capitals were up 1.4% and combined regionals were up 1.6% for the quarter. Sydney was up 1.1% for the quarter and up 1.3% annually, according to Cotality (formerly CoreLogic). Darwin 4.9%, Perth 2.1% and Brisbane 2.0% saw the largest increases over the quarter. On an annual basis, Adelaide was up 8%, with Perth and Brisbane both up 7%. Melbourne was the only capital to go backwards on an annual basis, down -0.4%. While rent increases continued to ease across the quarter on a national basis, up 2.7%, the majority of capitals were well ahead of that figure. Darwin at 6.2% led the way, with Hobart at 5.3% and Perth at 4.9% showing the strongest growth in rents. Melbourne at 1.2% and Sydney at 1.9% saw the most subdued growth.
On the people vs shelter issue, Cotality noted “dwelling approvals remain 23.9% below the 20,000 a month required to meet the national housing accord targets.” And while rolling net long term and permanent arrivals (or new people in the country) were edging downward throughout 2024, since January 25 that has reversed. The number sits well above 400,000 net new arrivals annually. This makes a mockery of the treasury budget forecast of 260,000 for 24/25. Notably, the annual net rolling figure pre covid was never above 300,000. Since mid 2023 it’s never been below 400,000. The Australian government continues to talk about the importance of increasing housing supply at the same time it continually, and quietly, increases the demand for housing.
Market Overview
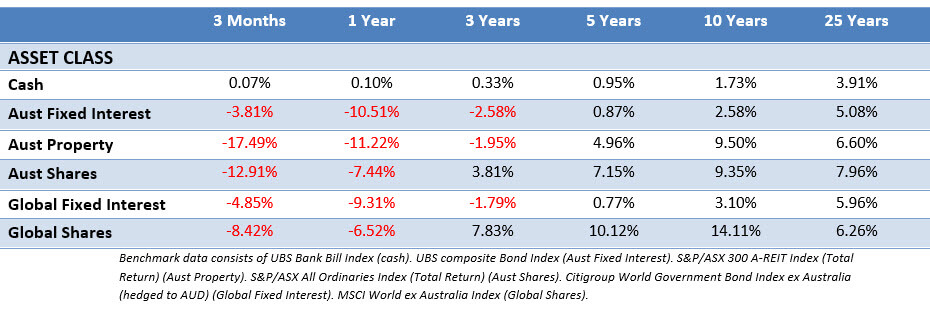
Asset Class Returns
The following outlines the returns across the various asset classes to 30 June 2025.

Global stocks saw a healthy bounce across the board in Q2. Currency markets were volatile, with the Australian dollar falling sharply against the USD as the quarter began, but it quickly bounced, before strengthening through the rest of the quarter. At the same time the AUD slightly weakened against the Euro. MSCI World ex Australia (Hedged) was up 9.45% for Q2, while the unhedged index was up 5.94%. US large caps were up 10.94%, while US small caps climbed 8.50%. MSCI World Ex US in USD was up 12.03% for the quarter, and year to date is ahead of the S&P 500 by 11.70%.
The Australian stockmarket sprang back to life, while Australian listed property was back in the green, up 13.4% after two consecutive quarterly losses. Bonds were influenced early by tariff concerns, but mostly depended on the decisions of Central Banks. In the US where the Fed was on hold, the 10-Year US Treasury yield was flat across Q2, inching from 4.21% to finish at 4.22%. US 2-year Treasury Note yields edged downward during Q2, from 3.89% to 3.72%. In the UK, the 10-year Gilt yield fell from 4.68% to 4.48%. In Australia the 10-year yield saw some sharp intra-quarter movements as it slipped from 4.39%, to finish at 4.17%. While the 2-Year government bond yield slid from 3.68%, to finish at 3.22%.
In the US, there were decent gains led by info tech and communication services as investor appetite for some of the Magnificent 7 stocks reignited. Again, stocks with exposure to artificial intelligence saw a recovery after weakness earlier in the year. US stocks were also supported by corporate earnings for Q1, which were generally robust. The underperforming sectors were healthcare, down -7.8% and energy down -8%, with the Trump administration seeking to lower drug prices in the US, which put pressure on some healthcare companies.
In the Eurozone, stocks posted decent gains broadly in Q2 with the MSCI EMU up 4.95% in EU terms and now up over 12% for the year. In France, however, the CAC 40 slipped -1.6%, while the German DAX was up 7.87%. Industrials and real estate sectors were the strongest performers. Within industrials, it was defence stocks continuing their good performance, as an agreement at the NATO summit for countries to lift defence spending ensured interest in the sector continued. Consumer discretionary, healthcare and energy were the strugglers.
In the UK, the FTSE All-Share moved higher. With the best performing sectors being industrials, telecommunications, utilities and real estate. The large cap FTSE 100 was up 2.07%, but the strongest performers were the small and mid-sized companies which bounced strongly after an underwhelming Q1. The mid cap FTSE 250 was up 11.04%, and UK small caps were up 10.38%. The underperforming sectors were mostly energy and healthcare, both having a larger exposure in UK large caps, which explains the performance difference by size.
In Japan, The Japanese stockmarket was up in Q2, with the broad market TOPIX Index up 7.3% in yen terms. The Nikkei 225 outperformed the TOPIX, up 13.67% as large caps bounced back after a weak Q1. As elsewhere, market sentiment was weak initially as the Trump Liberation Day announcement of “reciprocal” tariffs hit, but then quickly improved after positive developments in trade negotiations with China and other key partners. Many Japanese companies released full-year results and provided guidance for the fiscal year ahead. While earnings forecasts were cautious, shareholder returns via dividend increases and buybacks rose significantly. Corporate governance reforms and efforts to enhance return on equity further underpinned the market’s performance during Q2.
Asia (ex-Japan) and Emerging markets were healthy in Q2, with MSCI AC Asia ex Japan Index up 6.77% in Australian dollar terms, while the MSCI Emerging Markets Index was up 6.49%. South Korea posted double-digit returns as political instability subsided, while strong gains were also made by Taiwan as it continued to benefit from optimism about artificial intelligence. India underperformed as expensive valuations weighed on the market. China posted a small positive return over the quarter, as the early part saw escalating tariff threats between the US and China, which eventually subsided with a more conciliatory mood between the countries. The Saudi Arabian market struggled as geopolitical tensions in the Middle East took their toll. Despite concerns about an energy shipping disruption, that provided a brief oil price spike, an oversupply of oil ensured prices closed down at the end of the quarter.
In Australia, the ASX 300 was up 9.48% in Q2, with every sector in the green except for materials, down -0.36% as the big miners were down slightly for the quarter. The leader was information technology, up 26.87% as Wisetech bounced after its Q1 selloff, Xero also saw a healthy price appreciation. Financials, up 15.67%, and communication services up 14.08% were the other outperformers. Along with materials, utilities, healthcare and consumer staples were the strugglers, but the trio did manage a gain, unlike materials. The financials result was heavily influenced by Commonwealth Bank continuing to scream upward and hitting a new record high during the quarter. This has pushed the bank’s yield down towards 2.5%, and well out of the “dividend darling” category. Some have questioned its lofty valuation as the most expensive bank in the world. Australian Super has taken a position to be underweight CBA, which caused its own performance to lag other superfunds for the financial year. Finally, the ASX Small Ordinaries was up 8.62% for Q2.
This material is provided for information only. No account has been taken of the objectives, financial situation or needs of any particular person or entity. Accordingly, to the extent that this material may constitute general financial product advice, investors should, before acting on the advice, consider the appropriateness of the advice, having regard to the investor’s objectives, financial situation and needs. This is not an offer or recommendation to buy or sell securities or other financial products, nor a solicitation for deposits or other business, whether directly or indirectly.