On the 4th of August, CommSec, Australia’s largest online broker released a statement. It began:
The limits on trades without a cash deposit are changing from 04 September, 2021.
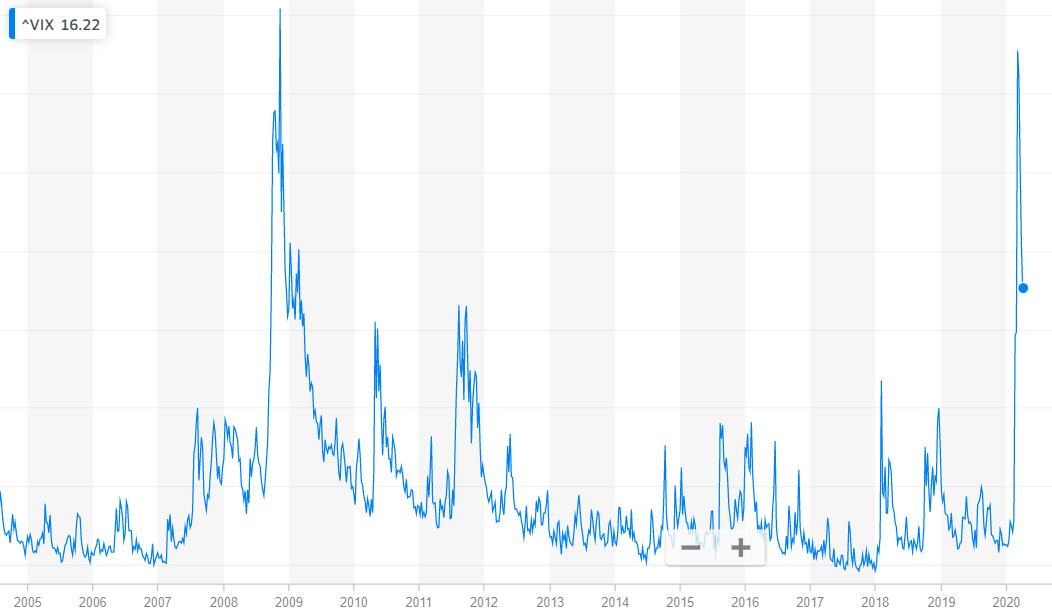
In light of recent market volatility, CommSec is changing trading limits to help protect our customers and minimise risk associated with investing and settlement.
In the good old days, there was something known as T+3. You could buy a stock and your broker would give you 3 days to settle the trade, i.e. come up with the money. It provided an open window for retail traders to chance their arm on buying a stock, hoping it went up and then selling out before having to put down any money. If you were lucky and brave, you might have been able to scalp a profit. More recently, the T+3 became T+2 as the ASX changed its trading rules.
Same principle applied, but retail traders could still jump in and out of stocks on a short-term basis without needing to have much (or any) cash in their account. The more risk averse and experienced wouldn’t hold beyond the trading day, lest they woke up to a surprise the next morning. A poor announcement or a trading halt, which meant they couldn’t exit their position and would have to stump up the capital.
The first few words of the second sentence of CommSec’s statement were curious. Anyone who has been watching the market recently could tell you volatility has been low, especially in the past two months, so to make this change due to “recent market volatility” seemed strange. Unless you recall Commonwealth Bank’s half year result from February.
CommSec, the bank’s brokerage service, added more than 230,000 new users in the last six months alone as Australia experiences its own share of market mania. Seven in ten of those are trading via the normal app or the micro investment app CommSec Pocket, suggesting much of the growth is being driven by a younger demographic.
Putting two and two together, it would seem some of these new users have taken the opportunity to T+2 trade without having the money to settle. They’ve likely been caught out by a poor announcement which left them heavily down, or trading halt which left them unable to exit their position before settlement date. CommSec now wants more skin in the game. Prior to the announcement, Commsec had a $25,000 limit without needing a deposit for leading stocks (bigger/known) and $7,500 for non-leading stocks. They’ve cut them to $5,000 and $1,000 limits respectively.
Occasionally, posts have appeared on social media investment groups, where a panicked user asked what to do because they didn’t have money to clear a trade that went against them. While some thought these posts were people trying to wind the group up for attention, CommSec’s policy changes would suggest they were truthful. Some played a dangerous game and were caught with their pants around their ankles, and without the money to settle their trades.
With the pandemic lockdown turning investing into a video game for new entrants, it’s no surprise people have gotten themselves into trouble. The suggestion is a lot of it’s coming from social media influencers egging the naïve on. Something ASIC has some trouble dealing with, as noted when an ASIC manager spoke to a recent conference.
“There’s a fragmented nature when we’re talking about social media and the internet; there’s the scale of information that we have to monitor, there’s ease of access to that information and the rapid churn rate – these are considerations that make it a quite complex environment for us.”
“While social media can be okay as a means of getting background information. Use your judgement and think about risks like the fact that advice on social media may not be licensed, you might be getting information on something that is inaccurate.”
And:
“Those providing it might have interests in the advice, they might be promoting a certain product so that’s something to bear in mind.”
The Federal opposition was keen to weigh in on the matter, with Labor MP, Julian Hill suggesting
“Everyday Australians are being left to look to social media and TikTok influencers,” and “the minister doesn’t think this is a problem as it is no different to speaking to someone in the pub, but ASIC are concerned. These ‘influencers’ are taking kickbacks, that is what the Government is leaving people to, and it is a return to the bad old days of commission.”
While it’s opportunistic from the opposition, especially as they’ve never been friends of the professional advice community, the MP makes a good point. The person in the pub talking about stocks previously had an audience of one or two. Now some have an audience of several hundred thousand and it’s often not clear if they’re partnered with a stock or investment service for promotion.
More than ever it’s easy to get online and pose like an expert. If someone gathers enough of a following, companies will want them to push their products. Finding unbiased, common-sense information isn’t becoming any easier.
Which brings us to a question posted to an online financial independence forum recently. A person had concluded they and their partner were ready to delegate their affairs to a financial adviser, so they asked how should they go about finding one? How useful were the answers to their question? What followed was the equivalent of an online pub brawl.
Without knowing a thing about the couple, several said they shouldn’t bother working with an adviser and just do it themselves. Two people got into an argument about active and index management, while others got into an argument about investment platforms, with one claiming they were designed to rip off clients – if only fraudster Melissa Caddick’s clients had known about the value of having their funds with a verifiable third-party platform!
The person asking the question was likely more confused after reading through the mess.
There’s never been so much freely available information, meaning information has never been more valuable and worthless at the same time. The right information – priceless. The rest? Not so much
Always consider the source.
This represents general information only. Before making any financial or investment decisions, we recommend you consult a financial planner to take into account your personal investment objectives, financial situation and individual needs.